
Request A Quote

Phone: 416-244-6476
Email:

    Top Wheel Motor Manufacturers and Suppliers Worldwide

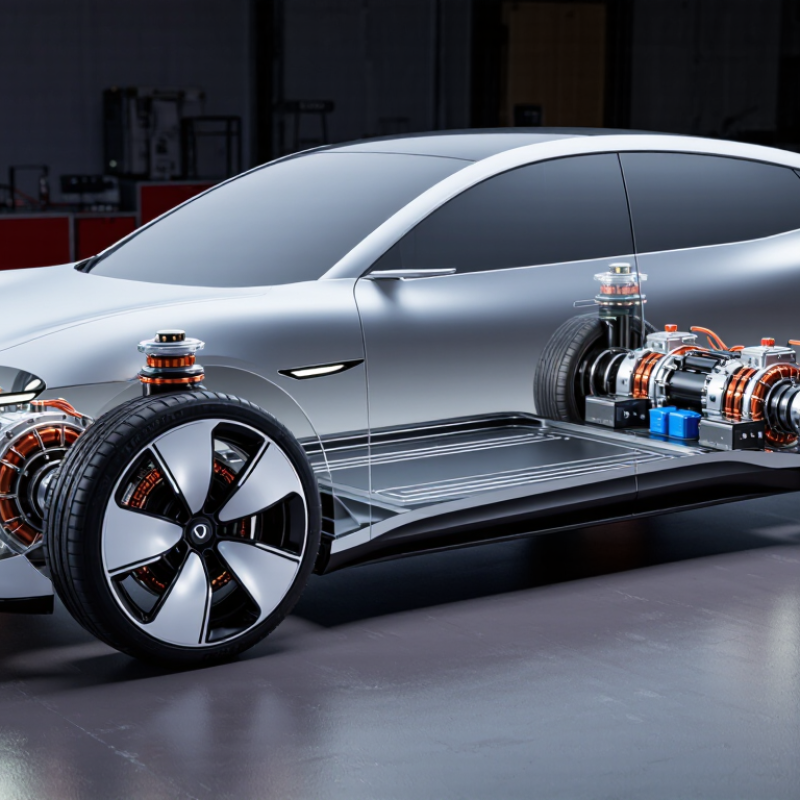
    Wheel Motor technology is reshaping how electric vehicles use space, torque, and drivetrain components. Unlike conventional motors, it places propulsion directly inside or near the wheel assembly. This design can remove mechanical transmission parts and create more flexible vehicle platforms. However, packaging remains difficult. Heat, unsprung mass, sealing, and road impact still challenge engineers.

    The International Energy Agency’s Global EV Outlook 2024 reported that electric car sales exceeded 17 million units worldwide in 2024. This expanding vehicle base strengthens demand for efficient, compact propulsion solutions. It does not guarantee rapid Wheel Motor adoption. The technology remains more specialized than central-drive systems. IDTechEx has also identified in-wheel motors as an important development area for electric mobility, robotics, and autonomous platforms. Market forecasts differ considerably, partly because suppliers define the segment differently.

    This guide examines leading Wheel Motor manufacturers and suppliers worldwide. It considers motor architecture, continuous torque, peak power, thermal management, durability, and production readiness. Company scale matters, but it is not enough. A strong prototype may still face costly validation and limited volume manufacturing. Real-world experience matters here. A motor must survive potholes, water spray, vibration, and repeated braking cycles.

    Manufacturers such as Protean Electric, Elaphe, Nidec, and other specialized developers receive attention across industry discussions. Their products and strategies are not identical. Some focus on passenger vehicles, while others target commercial vehicles, robotics, or specialty mobility. Buyers should verify laboratory claims against independent testing and vehicle-level results. Reports provide useful direction, but they are not final proof. The market is promising, yet still developing. That uncertainty deserves careful evaluation.
    Top Wheel Motor Manufacturers and Suppliers Worldwide

    Wheel Motor Fundamentals: In-Wheel Torque, Power Density, and IP67 Protection

    Top Wheel Motor Manufacturers and Suppliers Worldwide

    Wheel motors place the drive unit inside, or close to, the wheel hub. This layout delivers direct in-wheel torque with fewer mechanical transmission parts. During low-speed testing, strong starting torque helps a loaded vehicle move smoothly on ramps and uneven ground. However, torque figures need context. Peak torque may last only seconds, while continuous torque shows usable working performance.

    Power density matters when space and weight are limited. A compact motor can release more power per kilogram, but higher output creates more heat. Engineers should examine cooling paths, winding temperature, controller limits, and duty cycles together. A motor that performs well on a test bench may struggle in stop-and-go service. That detail is easy to miss.

    IP67 protection means the enclosure resists dust entry and temporary water immersion under specified test conditions. It does not make every connector, cable seal, or bearing permanently waterproof. Suppliers should provide test reports, temperature ratings, installation guidance, and traceable quality records. In practical inspections, sealing often depends on correct torque and clean mating surfaces. One imperfect seal can defeat an otherwise robust design. Evaluation should include vibration, mud, washdown exposure, and repeated thermal expansion before selecting a worldwide manufacturing or supply partner.

    Power Density Reference 10 kW continuous output ÷ 20 kg motor mass = 0.50 kW/kg
    IP67 Protection Dust-tight protection and temporary immersion in water up to 1 meter for up to 30 minutes under IEC 60529 test conditions.

    This physics-based reference chart shows the wheel torque required to maintain a constant 10 kW output. Torque is calculated using T = P ÷ ω, so torque decreases as rotational speed increases. Actual in-wheel motor performance also depends on thermal limits, voltage, current, gearing, tire radius, and duty cycle.

    Global Industry Snapshot: 48–800 V Systems Across EV and Industrial Markets

    Wheel motor manufacturers and suppliers now serve a voltage spectrum from compact 48 V platforms to demanding 800 V architectures. This range covers electric scooters, warehouse vehicles, buses, agricultural equipment, and passenger cars. The IEA’s Global EV Outlook 2024 reported almost 14 million electric car sales in 2023. That growth increases demand for integrated propulsion, especially where space and mechanical simplicity matter.

    At 48–96 V, suppliers often prioritize safety, low maintenance, and affordable controllers. Higher-voltage systems can reduce current, cable weight, and charging losses. They also require stronger insulation, advanced thermal management, and careful electromagnetic compatibility testing.

    The U.S. Department of Energy identifies efficiency and heat control as critical factors in electric-drive development. In real vehicles, a sealed wheel motor may face rain, dust, curb impacts, and repeated stop-start cycles. Laboratory efficiency alone is not enough.

    Some supplier forecasts disagree, partly because wheel motor definitions vary across reports. That uncertainty deserves more attention.

    Tips: Compare continuous torque, not only peak torque. Request measured data at different temperatures and speeds. Check ingress protection, bearing life, service access, and controller compatibility. For 800 V projects, confirm insulation testing and fault-response procedures early. A lower-voltage design may still win when infrastructure, operator training, and repair costs dominate. Procurement teams should also ask for field-test evidence. Marketing sheets rarely show every weakness.

    Worldwide Manufacturer Map: China, Europe, Japan, and North America

    Wheel motor manufacturing is distributed across several engineering centers. China offers broad production capacity, dense component networks, and competitive tooling access. Many suppliers support prototypes, fleet trials, and high-volume assembly from the same industrial regions. Factory visits often reveal the real difference: winding cleanliness, sealing discipline, and traceable testing. That evidence matters more than a polished catalog.

    Europe tends to emphasize vehicle integration, functional safety, and demanding winter or urban duty cycles. Suppliers commonly document torque curves, thermal limits, braking interfaces, and software communication requirements. Japan is known for careful process control, compact packaging, and long-term reliability testing. North American producers often focus on work vehicles, agricultural platforms, and serviceable designs. Regional strengths overlap. No market is perfect.

    A worldwide manufacturer map should include more than factory locations. Buyers should compare test standards, bearing life, salt-spray results, noise levels, and replacement lead times. Ask whether quoted power is continuous or peak. That small detail can change vehicle performance. In practice, supplier selection is rarely linear. A lower-cost unit may require custom cooling or extra validation. A premium unit may still face delayed parts. I have seen promising comparisons fail when connector sealing was checked too late. One late sealing test can reset an entire sourcing schedule.

    Supplier Comparison: Efficiency, Peak Torque, Thermal Load, and ISO 26262

    Comparing wheel-motor suppliers requires more than catalog horsepower. The IEA Global EV Outlook 2024 reported over 14 million electric-car sales in 2023. That scale increases pressure on compact, efficient drive units. In supplier trials, measure inverter-to-wheel efficiency across urban, highway, and hill cycles. Peak efficiency alone is misleading. A motor reaching 96% briefly may perform worse than one sustaining 92% during daily use. Record speed, battery voltage, ambient temperature, and software calibration.

    Peak torque should be tested at the wheel, not only at the shaft. Suppliers must state duration, starting temperature, and voltage limits. Thermal load is equally important. Use thermocouples near windings, bearings, and power electronics. A practical test includes repeated launches, climbing, and regenerative braking. The ISO 26262 framework addresses functional safety processes, including hazard analysis, hardware metrics, and software controls. It does not certify efficiency or torque. Request the safety case, target Automotive Safety Integrity Level, diagnostic coverage, and evidence from fault-injection tests.

    Industry road-load studies, including data published through the U.S. Department of Energy’s vehicle technology programs, show that auxiliary losses and temperature strongly affect real-world efficiency. The detail is easy to overlook. A spreadsheet can look precise while missing tire slip or uneven cooling. I would also question impressive torque figures without derating curves. Suppliers should provide endurance results, thermal recovery time, production traceability, and independent validation. No single metric wins. The test conditions decide the result.

    Top Wheel Motor Manufacturers and Suppliers Worldwide - Supplier Comparison: Efficiency, Peak Torque, Thermal Load, and ISO 26262
    Technical Dimension Representative Production Range Typical Benchmark Target Engineering Interpretation Recommended Supplier Evidence
    Motor Architecture Direct-drive permanent-magnet synchronous motor; optional reduction gearing Direct drive preferred Direct drive reduces gearbox losses and packaging complexity, while geared designs can increase wheel torque density. Motor topology, sectional drawings, electromagnetic design report, and system efficiency map
    Nominal DC-Link Voltage 400–800 V DC 800 V for high-power platforms Higher voltage can reduce current for the same power level, helping reduce conductor and inverter losses. Validated voltage range, insulation-coordination report, hipot test, and inverter compatibility data
    Peak Motor Efficiency 92–97% ≥95% Peak efficiency is normally measured at a specific speed, torque, voltage, and coolant condition; it should not be treated as full-cycle efficiency. ISO 17025 laboratory report, efficiency map, test temperature, and measurement uncertainty
    High-Efficiency Operating Area Approximately 70–90% efficiency over selected operating points Broad efficiency plateau A wide high-efficiency area is more meaningful for vehicle energy consumption than a single maximum-efficiency figure. Full speed-torque-efficiency map covering drive and regeneration quadrants
    Peak Wheel Torque 300–1,000 Nm per wheel ≥600 Nm per wheel Peak torque supports launch and transient performance. The value must be evaluated together with wheel diameter, vehicle mass, and peak duration. Dyno test curve, torque sensor calibration, speed range, and peak-duration definition
    Continuous Wheel Torque 150–450 Nm per wheel ≥250 Nm per wheel Continuous torque is more relevant to sustained gradients, towing, and thermal-limited operation than short-term peak torque. Continuous torque-speed curve at stated coolant temperature and ambient conditions
    Peak-Torque Duration 5–15 seconds ≥10 seconds Peak torque is commonly limited by winding temperature, magnet temperature, inverter current, or tire traction. Time-based overload profile, temperature trace, inverter-current limit, and repeatability data
    Cooling Arrangement Liquid jacket, oil spray, or combined stator-and-rotor cooling Liquid or oil cooling Liquid and oil cooling generally provide higher continuous power capability than passive air cooling in compact wheel-end systems. Cooling schematic, flow-rate requirement, pressure drop, heat-rejection capacity, and leakage test
    Continuous Thermal Load Approximately 20–60 kW per wheel Application-dependent Thermal load depends on duty cycle, road speed, ambient temperature, cooling flow, and allowable winding temperature. Thermal steady-state test, duty-cycle simulation, thermal network model, and derating strategy
    Winding Temperature Limit Typically 150–200°C, depending on insulation system Verified below the design limit The insulation thermal class, magnet temperature, bearing temperature, and local hot spots must all be checked separately. Thermocouple or fiber-optic measurements, thermal-class declaration, and hot-spot analysis
    Operating Ambient Temperature Approximately −40°C to +85°C −40°C to +85°C Cold-start torque, lubricant behavior, sensor accuracy, and power derating should be verified across the complete temperature range. Temperature-chamber test report and cold-start/high-temperature performance curves
    Ingress Protection IP67 to IP6K9K, depending on configuration IP6K9K for exposed wheel-end use IP67 covers dust protection and temporary immersion; IP6K9K additionally addresses high-pressure, high-temperature water jets. IEC 60529 and ISO 20653 test reports, including connector and cable-entry configuration
    Regenerative Braking Capability Typically 20–60% of peak motoring torque Matched to battery and tire limits Regeneration is constrained by battery acceptance power, inverter limits, tire-road adhesion, and vehicle brake-control strategy. Four-quadrant torque map, battery-charge-power limits, and blended-braking validation
    Functional-Safety Framework ISO 26262 development process with item definition, hazard analysis, safety goals, and safety mechanisms ASIL allocation documented ISO 26262 is a functional-safety standard; compliance depends on the defined item, safety lifecycle, hardware metrics, software process, and safety case. Safety plan, HARA, FSC/TSC, FMEDA, diagnostic coverage, dependent-failure analysis, and safety manual
    ISO 26262 Hardware Evidence SPFM, LFM, PMHF, fault-injection results, and production-control evidence Third-party assessment available Hardware-metric targets are determined by the assigned ASIL and system architecture; the supplier should provide assumptions and diagnostic dependencies. FMEDA, fault-injection report, safety-analysis assumptions, and independent assessment statement
    Automotive Quality System IATF 16949-based quality management with APQP, PPAP, FMEA, SPC, and traceability IATF 16949 certified Quality certification supports repeatable manufacturing but does not replace product-specific validation or functional-safety evidence. Current certificate, control plan, process capability data, PPAP package, and change-control procedure
    Validation Priorities Efficiency, torque accuracy, thermal endurance, vibration, corrosion, water ingress, EMC, and abuse testing Full vehicle-duty-cycle validation Wheel motors experience road shock, unsprung-mass vibration, water splash, debris impact, and repeated thermal cycling. DV/PV matrix, durability profile, environmental test records, EMC reports, and end-of-line test coverage
    Data scope: The figures shown are industry benchmark ranges for production-oriented wheel-motor systems and are intended for supplier screening and technical comparison. They are not attributed to any specific company or brand. Final values must be confirmed using supplier test conditions, vehicle duty cycles, applicable standards, and product-specific validation reports.
    Reference framework: ISO 26262 functional-safety principles, IEC 60529 ingress-protection ratings, ISO 20653 road-vehicle IP codes, IATF 16949 automotive quality practices, and standard electric-machine dynamometer testing.

    Procurement Standards: IATF 16949, IP69K, Testing, and Production Capacity

    Selecting wheel motor suppliers requires more than comparing torque curves and unit prices.

    IATF 16949 certification should cover the exact production site and product scope. Buyers should request current certificates, audit findings, process flowcharts, control plans, and PPAP evidence.

    A certificate alone proves little. Production records should show traceability from copper wire and magnets to final inspection. The International Energy Agency reported nearly 14 million electric car sales worldwide in 2023, increasing pressure on suppliers to scale without weakening process control.

    IP69K testing should replicate real exposure, including heated water jets, high pressure, rotating angles, and repeated sealing cycles.

    ISO 20653 provides a useful reference for road-vehicle ingress protection. Procurement teams should also review vibration, salt spray, thermal shock, endurance, and noise testing. Testing must include failed samples, not only successful reports.

    The OICA recorded more than 93.5 million motor vehicles produced globally in 2023, so capacity planning deserves measurable evidence. Ask for annual capacity, current utilization, bottleneck equipment, staffing plans, and verified run-at-rate results.

    A factory may quote impressive output, yet lack enough end-of-line testers. That weakness is easy to miss. Supplier scorecards should therefore combine certification status, test repeatability, defect rates, delivery performance, and recovery time after equipment failure.

    Personally, I would challenge optimistic capacity figures until an on-site audit confirms them.